
Stop Guessing, Start Measuring: The Only Way to Know if Your Business Solution Actually Worked
When things go wrong—a project stalls, customer complaints rise, or your new business solution doesn’t deliver—what’s the immediate reaction? It’s often to blame the people or to implement a quick, costly fix based purely on hope.
You’ve invested significant time and money. A few weeks later, you find yourself asking, “Did it work?” The answer is frequently, “I hope so, things feel better.”
That phrase, “I hope so,” is the most dangerous phrase in modern business. It signals you’re running your operation on intuition and anecdote, not on data and demonstrable results. You are simply guessing with expensive resources.
The Cycle of Hope: Why Process Improvement Fails
Without clear metrics, you are trapped in a cycle that guarantees resources are wasted. The lack of proper ROI measurement ensures effort is misdirected:
- The Crisis: You identify a problem, such as inefficient operations or high churn.
- The Quick Fix: You implement a business solution—a new tool or an organizational change.
- The Wait: You judge success based on internal chatter or a general sense of relief, ignoring objective data.
- The Repeat: The problem resurfaces because you never truly understood why the last fix failed.
You cannot optimize what you don’t measure. Therefore, every successful business solution must start with data, not just hope.
The Crucial First Step: Establishing Baseline Metrics
The only way to break this cycle is to start every problem-solving journey by establishing Baseline Metrics. This is the objective, quantifiable data that defines your problem before you change anything. It is your starting line.
If you cannot measure the pain, you cannot measure the cure.
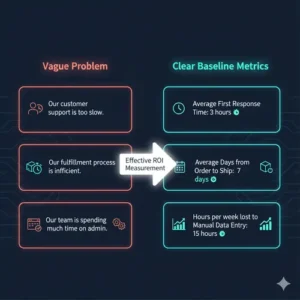
Here’s how to translate vague problems into clear baselines for effective ROI measurement:
#BusinessSolution #DataDriven #ProcessImprovement #TechAutomation #MeasureSuccess
Solve Your Problem with Measurable Tech Automation
After establishing the baseline, the most reliable path to achieving your target metrics is often through tech automation. Automation doesn’t just speed up work; it makes work measurable, repeatable, and eliminates human error.
Consider the metric: 15 hours per week lost to Manual Data Entry.
- A human solution (like “more training”) is inherently flawed and difficult to measure.
- A tech automation solution—integrating your CRM with your invoicing system—is the measurable fix. The results are instant and verifiable.
Automation is the ultimate solution for ROI measurement: It immediately reduces the Manual Data Entry metric, and the time saved directly translates into your project’s ROI.
Our Blueprint for Guaranteed ROI Measurement
For us, a business solution is only complete when we can show you the numbers that validate your investment. Our methodology is built entirely around creating, tracking, and proving metric improvement.
- Define the Success Scorecard: We identify the 2-3 most critical KPIs that will deliver the most business value. This is where we set the Target Metric for your process improvement. (Internal Backlink Placeholder: Link to a high-converting Case Study page here)
- Data-Informed Diagnosis: We utilize your existing data, not just interviews, to find the process failure causing the bad metrics. We stop the finger-pointing and focus on the workflow. (External Backlink Placeholder: Link to a reputable, external source on Root Cause Analysis here)
- Real-Time Tracking & Calibration: We continuously monitor the chosen metrics during and after implementation. This allows for necessary adjustments, ensuring we stay on target for maximum ROI measurement.
- The Final Report is Your ROI: Our final deliverable contrasts your starting baseline with your ending metrics, proving the direct return on your investment, often driven by tech automation. (Internal Backlink Placeholder: Link to a service page like “Business Process Optimization” here)
Your business deserves more than optimism. It deserves data-driven decisions and business solutions that are proven with data. Stop relying on “I think so,” and start demanding “I know so.”
Are you ready to stop guessing? Let’s discuss your current biggest bottleneck and how we can use tech automation to solve it once and for all and deliver true ROI measurement for your next business solution.
Ready to Stop Guessing and Start Measuring?
Don’t invest in another solution without knowing your baseline. Contact us to diagnose your process problems and define the metrics that matter for your business.
🔗 Contact us to build a data-driven strategy.
🗓️ Book a 30-minute consultation with our experts today.
Follow Us for More Insights on D2C and Digital Transformation
Stay ahead of the curve in e-commerce, digital strategy, and IT consulting by connecting with us on our social platforms: